Background Information for Middle and High School Teachers:
| No one here on Earth thinks a pimple on a face is "cool" but scientists think a spot on the Sun is very cool almost 2000 degrees cooler than surrounding gases which make up the surface, or photosphere, of the Sun! Darker in appearance than the rest of the Sun's surface, sunspots originally showed scientists that the Sun rotates on its axis. Recent research has revealed more about the magnetic properties of sunspots and the newest word is that minute amounts of water (in the gaseous state) may be found above spots. To learn about water on the Sun, press here. |

|
|
What is a sunspot? A cool, dark spot on the Sun, sunspots are often thousands of kilometers (1 km = 0.62 mi) across. The umbra of the sunspot is the dark, central region with the lighter penumbra surrounding it. |
|
Some sunspots may appear in groups or may seem to
be all alone. Lasting anywhere from a few days to months, sunspots
may be used to track the slow rotation of the Sun on its axis.
Indeed, using sunspots, Galileo Galilei and other early solar
observers calculated the rotation rate of the Sun, which is about 27 days.
Although Galileo didn't invent the telescope (Hans Lippershey of the Netherlands applied for the telescope patent in 1608), it was Galileo who made the telescope famous. Using a telescope with the capability of magnifying an object by 20 times, Galileo discovered the moons of Jupiter, the rings of Saturn, and studied Venus and the Moon. But late in the year 1610, Galileo (and others: Thomas Harriott, Johannes and David Fabricius, and Christoph Scheiner) with the help of his telescope, observed spots on the face of the Sun. (Using indirect methods of observation, sunspots had actually already been "discovered" by ancient Chinese, Greeks, and probably many others.) In the spring of 1611, Galileo traveled to Rome to discuss his observations with friends there; however, he did not actually do a detailed study of sunspots until April of 1612. Galileo's intellectual competitor, Christoph Scheiner, did not wait though and began a serious study of sunpots in 1611. Scheiner wanted to preserve the Aristotelian idea that heavenly bodies, including the Sun, were perfect and could not possibly be marred with spots. Scheiner therefore stated that the spots must be satellites, in orbit about the Sun (an a priori argument). Galileo however, attempted an argument based on observations, stating that the spots changed shape and could be seen to originate and disappear from the surface of the Sun. Further, based on observations of the changing velocity of sunspots as they approached the edge (limb) of the Sun, Galileo concluded that the spots were actually on the surface or very close to the surface of the Sun (i.e, within the solar atmosphere). Finally in April of 1612, Galileo, with the help of Bernedetto Castelli, began studying sunspots in earnest. Castelli actually invented the projection method of viewing the Sun which made detailed study relatively easy (and safe for the eyes!). With projection, the Sun's image is projected through the end of the telescope onto a piece of white paper. The distance of the paper from the telescope is adjusted until the solar image is large enough for reasonably accurate drawings. (As the paper is moved farther away from the telescope, the image will become larger, but fainter.) For more information on safely observing the Sun visit the Stanford University site. To learn more about Galileo and his sunspots, see the Galileo Project. |
During the time that Galileo was alive, the Sun went through
a drastic minimum in its sunspot cycle, a phase which possibly
affected the Earth's weather enough to cause a
"mini-ice age". (Sunspot cycle refers to the
waxing and waning of sunspots on the surface of the Sun.
The time period when the Sun is covered with the most spots,
the maximum, to the next maximum is about eleven years.)
Since there were few spots to be found on the surface of the
Sun during the time of Galileo's observations and because of a
lack of the necessary technology, further major solar discoveries
were not made until the ninteenth century. Then
in 1859, two independent observers, R.C. Carrington and
R. Hodgson, made a most interesting discovery. While
engaged in a routine study of the Sun, Hodgson and Carrington
saw a brightening of the solar surface
close to a group of sunspots. Carrington described it
in this way:
...when within the area of the great north group (the size of which had previously excited general remark), two patches of intensely bright and white light broke out...I hastily ran to call some one to witness the exhibition with me, and on returning within 60 seconds, was mortified to find that it was already much changed and enfeebled. Very shortly afterwards the last trace was gone, and although I maintained a strict watch for nearly an hour, no recurrence took place. Carrington and Hodgson had seen a white light solar flare. About twelve hours after witnessing this event, aurorae were seen in Earth's northern and southern hemispheres and scientists began to suspect that flares and aurorae were related. (Although Carrington knew that only one example was not enough for a true correlation, the seeds were sown for later discoveries.) We now know that solar flares do indeed produce energetic particles which affect Earth's magnetic field to create the aurorae. For more information on Earth's aurorae, press here. At the beginning of this century, sunspots were suspected to be sites of strong magnetic fields. To prove this, George Ellery Hale applied a discovery of Pieter Zeeman (made in 1896) now known as the Zeeman effect, that when light passes through a gas which is in a magnetic field, it becomes polarized. (To be polarized means that the light vibrates in a specific direction.) In theory, if the light from sunspots were polarized, Hale should be able to add a polarizing filter to his telescope and change the intensity of light coming from the sunspots, but not from the surrounding photosphere. (Polarizing sunglasses have the same effect on polarized light which has been reflected off the hood of a car.) In 1908, Hale applied his polarization test to sunspots observed with the 60 foot tower telescope at Mount Wilson in California. The results were exactly as Hale had expected, but the magnetic field strengths which he measured astounded him. Some of the sunspots had measured field strengths of 4500 Gauss, which is about 9000 times the strength of Earth's magnetic field (which is ~0.5 Gauss)! To learn more about measuring sunspot magnetic fields, press here |
|
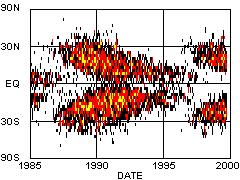
Approximately every eleven years, the number of spots seen on the Sun increases to a maximum. Records kept since about 1750 show that sunspots appear at higher latitudes at the minimum part of the sunspot cycle. As the cycle approaches the maximum, sunspots will be found closer to the equator of the Sun. Scientists have plotted the area covered by sunspots at a given latitude versus time; the resulting graph has a butterfly-like appearance. To learn more about butterfly diagrams, press here. |
|
The corona (a word from the Latin meaning crown), is
the outermost portion of the Sun's atmosphere; but,
because it is so faint, the corona is normally visible
only during a total solar eclipse when light from the
Sun's surface is blocked by the Moon. Changes in the
solar corona definitely correlate with sunspots and
the sunspot cycle. Notice in the photos, that at
different phases of the sunspot cycle, the shape of
the corona is startlingly different. Through modern
technology, scientists now study the corona with an
instrument called a coronagraph which produces
an "artificial" eclipse. Astronauts on
board Skylab used this type of instrument in the
early 1970s.
Since the corona of the Sun is so hot, it produces large quantities of x rays. By studying x-ray images scientists have discovered that the bright parts of the x-ray corona are associated with sunspots and that, as we have seen in the eclipse photos, the shape of the corona (as seen in x rays or white light) changes with the sunspot cycle. (To see images of the x-ray corona, try these pages at the University of Montana: Press Here.) Now when the Sun produces a flare or a coronal mass ejection, as much energy as a billion megatons of TNT may be released in just a few minutes. As a result of the explosion, solar gases are heated to tens of millions of degrees and electrons, protons, and heavy nuclei are accelerated to close to the speed of light. Today, scientists still do not understand exactly how flares and coronal-mass ejections work. To try and solve the puzzles of these events, many satellites have been launched, with better and better spatial and time resolution:
Activities Menu High School Concepts: Review Newton's Laws, the conversion of degrees to radians, how to calculate average velocity, and centripetal acceleration. Press here . Sunspot Classification: Using modified Zürich classes, students will study basic sunspot characteristics and classify several sample sunspots. Press here for the teacher's version. The student's version is located here . Middle School In Galileo's Footsteps (Grades 5-8): Students observe the instructor marking sunspot locations for five days. Data from the Big Bear Solar Observatory are provided. Questions at the end motivate discussion and conclusion-drawing. Press here for the teacher's version. The student's version is located here. Sunspot Q&A (Grades 5-8): Test your knowledge! Try the quiz, press here. Sunspots Art Activity (Grades 4-8): Create sunspots on paper, using a picture of the Sun as a model. The art medium could be crayons, pencils, or chalk. |
|
||||||||||||||||||||